BI Tools
Three consultants from the Paradigm SES team will be showcasing three popular BI Tools.

Ivan Casarrubias - Sr. Principal Consultant
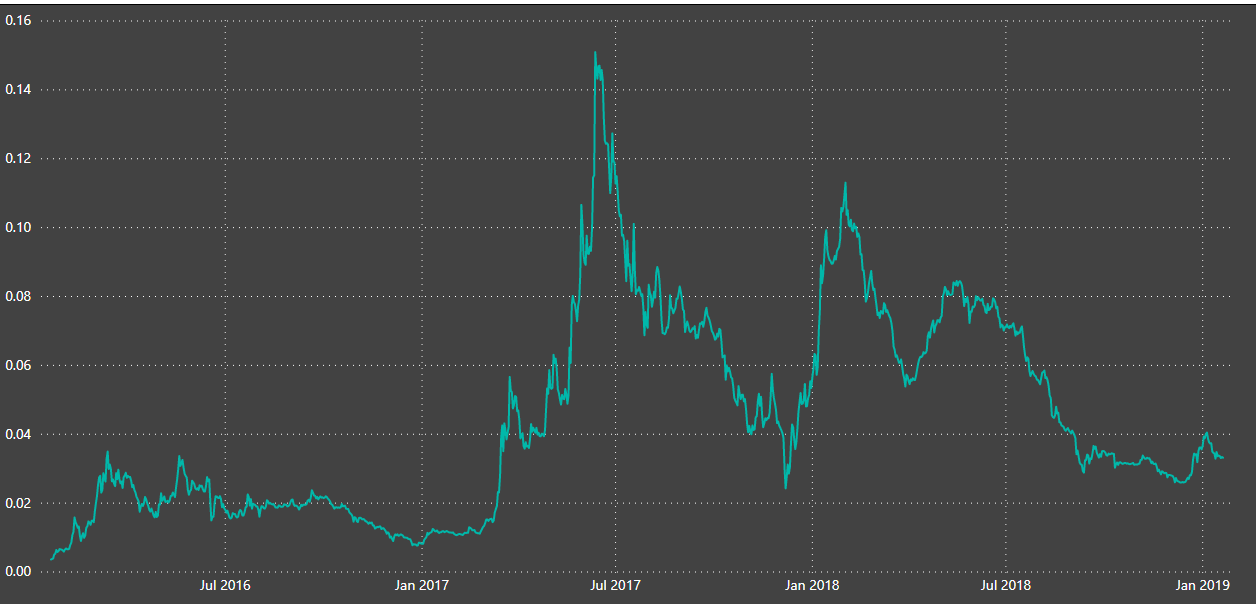
Ivan will be using Microsoft Power BI.


Henry Lin - BI Consultant
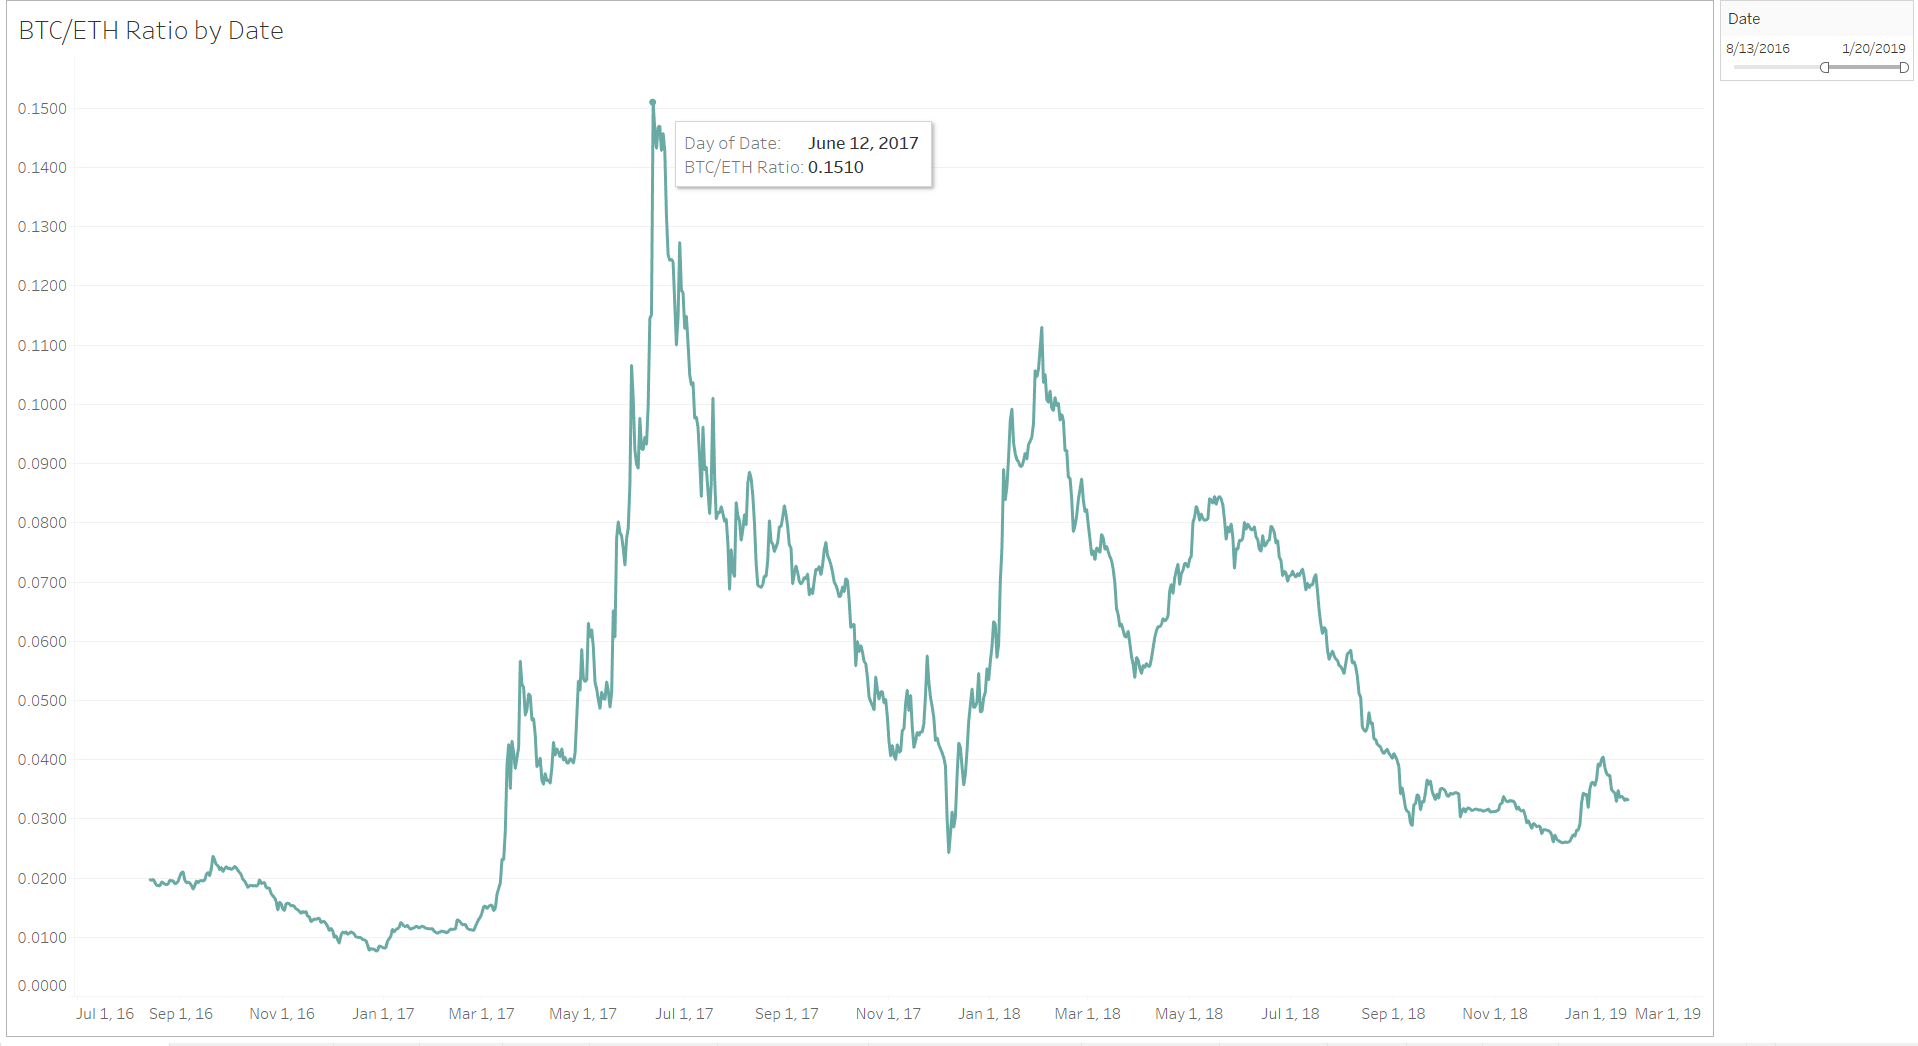
Henry will be using Tableau Desktop for his Dashboard.


Meghna Goswami - BI Consultant
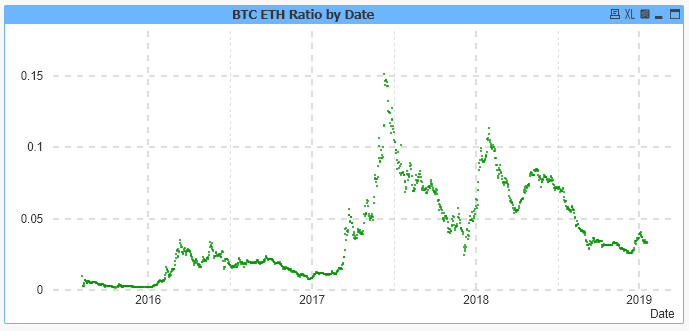
Meghna will be using Qlikview for her Dashboard.
KPIs
Daily Variation
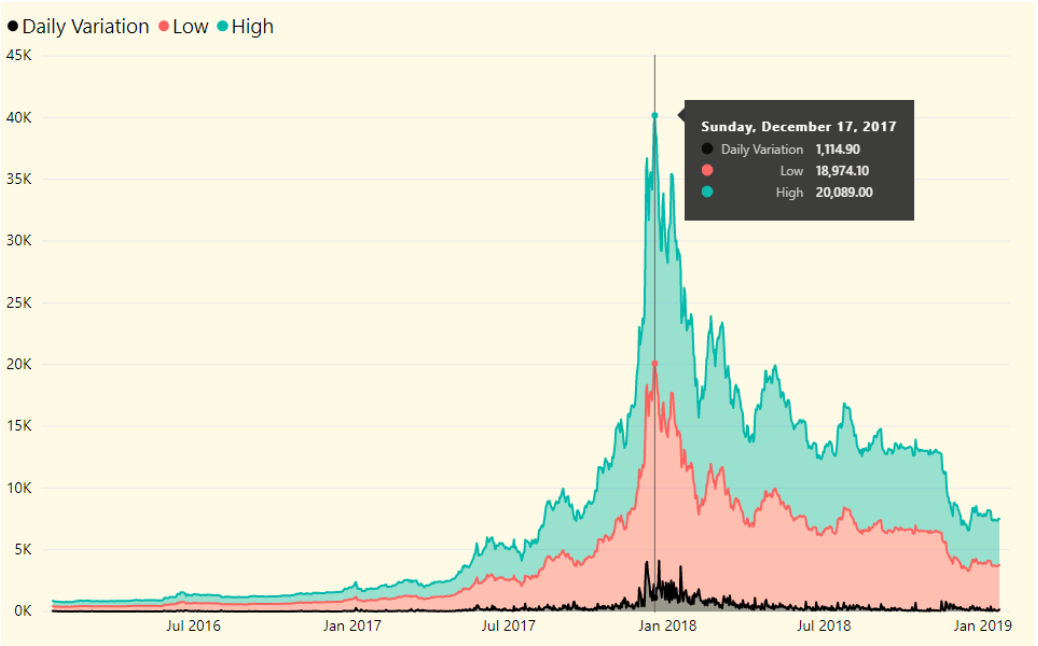
The daily price variation is an indicator of volatility for stocks. It is a measure of the difference between the highest and lowest values on a given trading day.
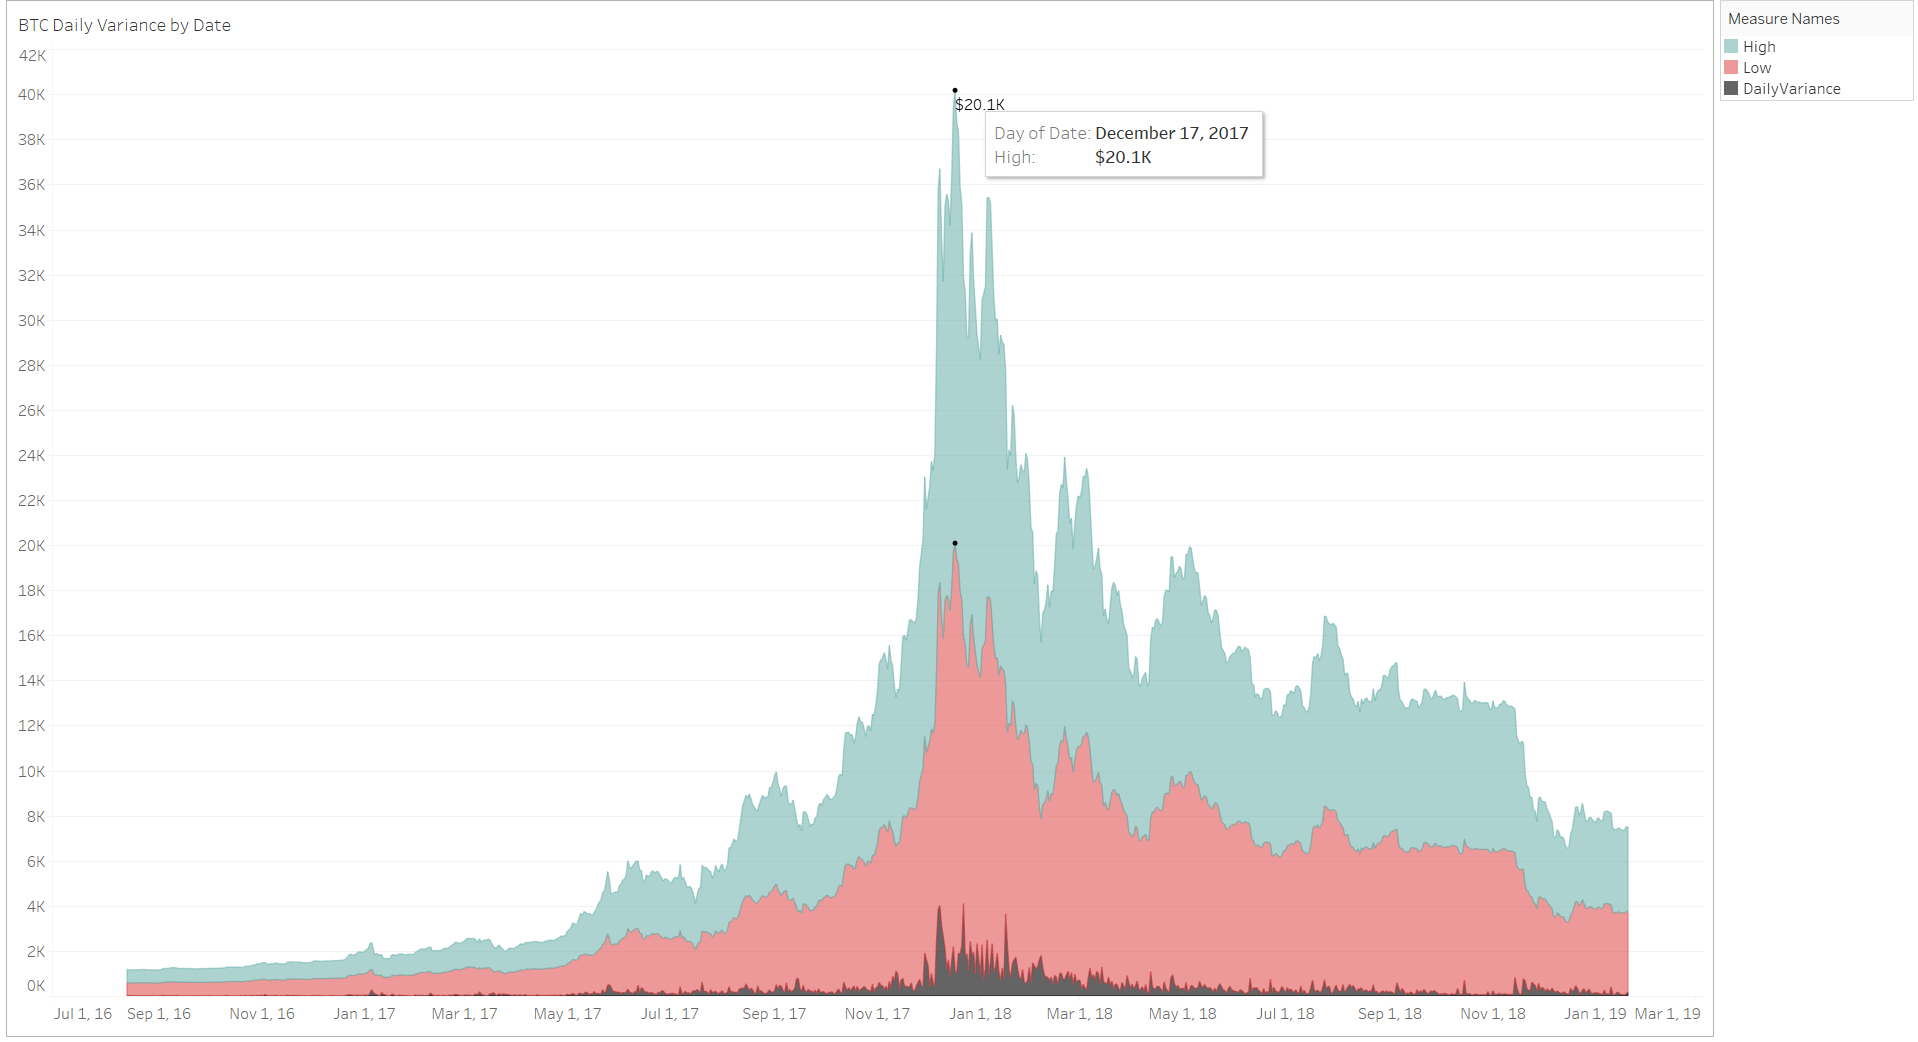
Although, daily price variation may also refer to the difference between one day's opening price and the next day's opening price, we will measure volatility with the former to measure the volatility of Bitcoin.
Analysis
The Highest Price on Dec 17, 2017 had a daily variation of $1,114.90. In theory, if a trader purchased 1 BTC at the lowest price of that day, and sold it the same day at the highest price, the trader would have made over $1,000 per BTC on that date.
Winner
The legend in Power BI hovers above the line chart and is also included in the tool-tip by default when you hover over a time-frame. Tableau's flat UI lacks the details that Power BI offers, and thus Power BI wins this KPI challenge.
Daily Change
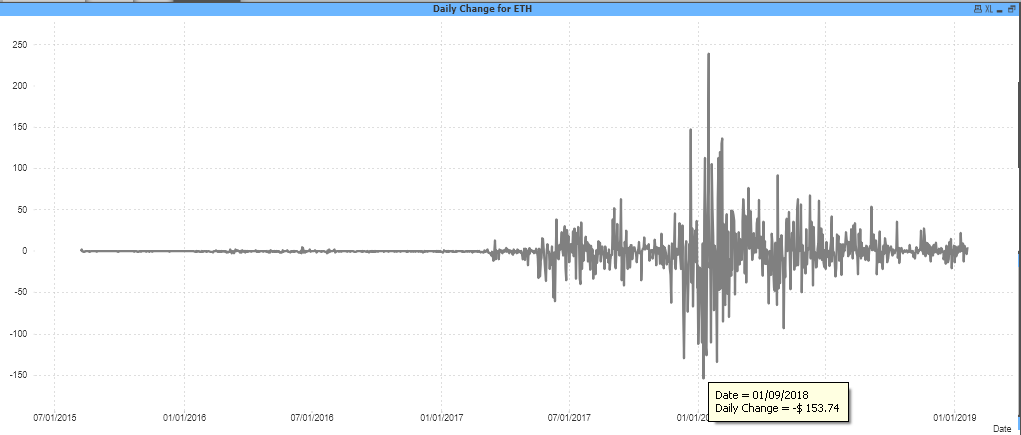
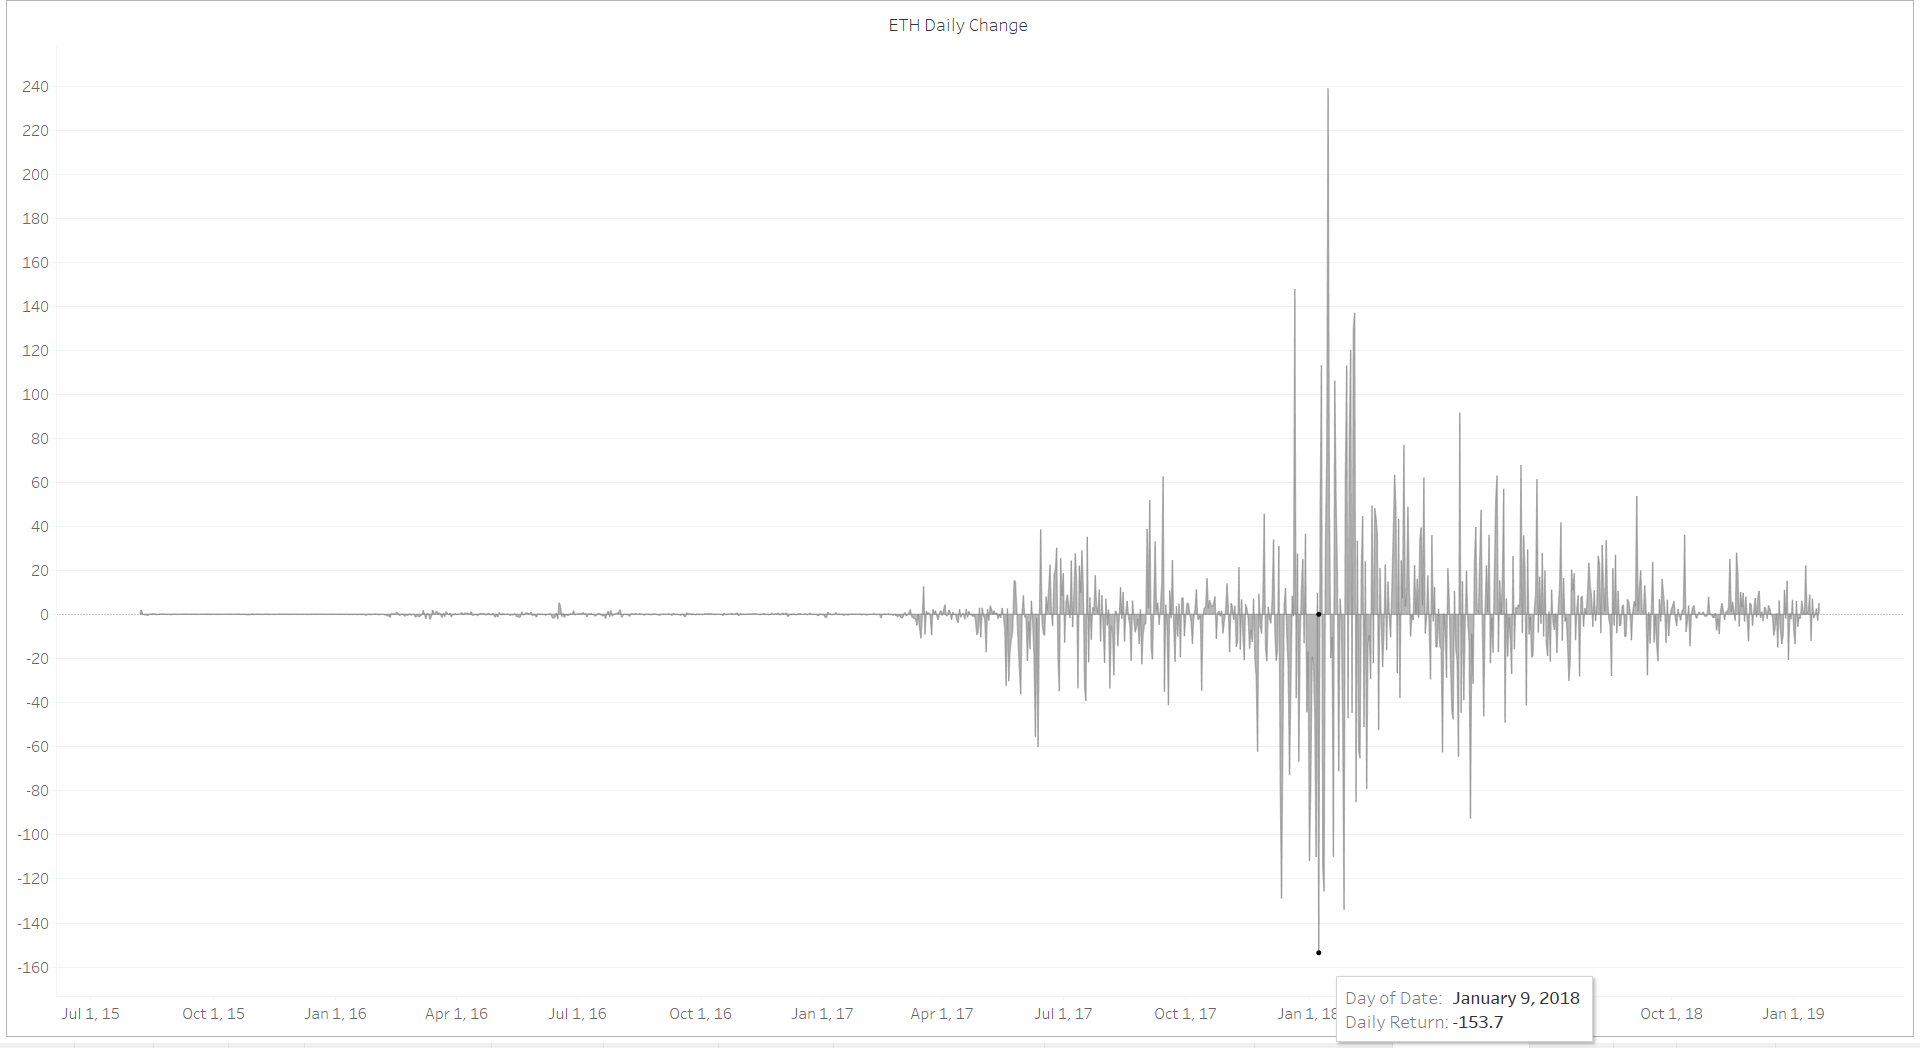
To calculate how much you gained or lost per day for a stock or cryptocurrency, subtract the opening price from the closing price. We named it "Daily Change" instead of "Daily Returns", since some days show losses, and negative results are sometimes difficult to understand.
Analysis
On Jan 9, 2018, Ethereum closed $153.74 less than the opening price for that day. This was the highest daily loss for Ethereum.
Winner
Compared to Qlikview's UI, Tableau's flat UI offers a cleaner and sleeker visualization. Qlikview's bulky UI is reminiscent of a decade-old Microsoft Access UI, and thus Tableau wins this KPI challenge.
Ethereum/Bitcoin Ratio KPIs
Let's combine the datasets and create a ratio by dividing the closing price of Ethereum by the closing price of Bitcoin. Can you guess which visualization belongs to Qlikview, Power BI and Tableau from the images below?
The closing price is the final price at which a security is traded on a given trading day. The closing price represents the most up-to-date valuation of a security until trading commences again on the next trading day.
The closing price is significant for several reasons. Investors, traders, financial institutions, regulators and other stakeholders use it as a reference point for determining performance over a specific time such as one year, a week, etc.
In fact, investors and other stakeholders base their decisions on closing prices.
Results
The UI is only one thing to consider when using software. Workflow and features are just as important. Tableau and Qlikview made Aggregation and time-series functions difficult to manage when compared to Power BI's Time-Intelligence and DAX features. When creating the Ratio KPIs, Power BI's Table Relationship Manager and M language made Tableau and Qlikview's table joining scripts seem too difficult for non-coders.
Below are some observations that our Business Intelligence consultants have regarding BI tool's used in this demo.
Tableau
Tableau offers a friendly user interface and drag-and-drop functions. The performance speed is faster than Power BI, as Power BI seems to suffer from lagging with larger datasets.
Tableau's high price-tag makes it difficult to use as a training tool. There is only a trial version available for those seeking to test this tool. Power BI Desktop is free.
Qlikview
Qlikview offers a very smooth and quick dashboard refresh. Visualizations do not lag as much as they do on Power BI. Unlike Tableau, Qlikview Personal Desktop is also free.
Qlikview generally requires high-level coding skills, knowledge of SQL, and in most cases, formal training to use QlikView’s proprietary query language. Both Tableau and Power BI use Multidimensional Expressions (MDX) as a query language which gives Excel users an advantage, as the syntax for MDX is similar to spreadsheet formulas.Which Business Intelligence tool is your favorite? Share this article with your friends and let them know which BI tool you find the most interesting.