what can onestream xf do?
- Through a single platform, OneStream XF can perform:
- financial consolidation
- financial reporting
- planning and budgeting
- OneStream XF can be used on-premise or on-cloud. This is useful for companies that may be upgrading from legacy systems, but still prefer to keep everything on-prem, rather than in the cloud.
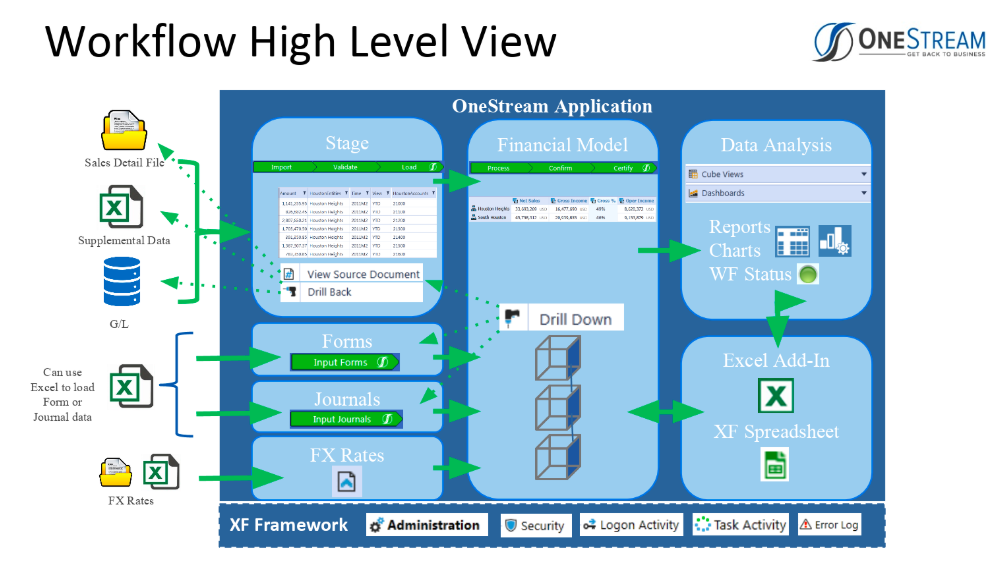
- OneStream's Workflow makes it easy for you to streamline the entire business process (from data loading to reporting).
- OneStream Xf's drill-down lets users drill down to a more detailed level view of the data (and even source level data). With a simple click, users can see all the underlying numbers that comprise a summary amount.