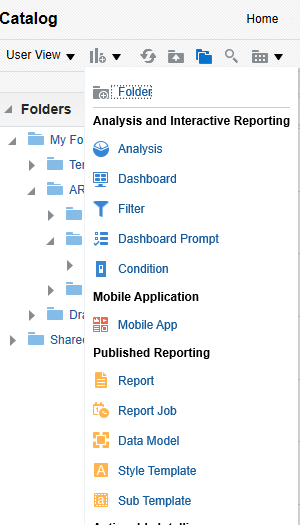
Step 1: Select “Data model” from the ‘New’ drop-down menu
Written By: Vivian Truong - Principal Consultant
Publication Date: 09/11/2020
Step 1: Select “Data model” from the ‘New’ drop-down menu
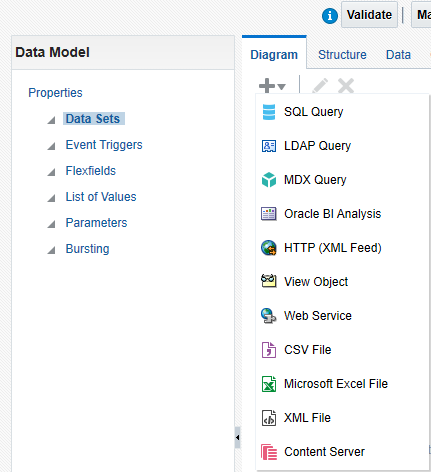
Step 2: The properties of the data model will be shown on the left-hand side of the window, we can customize the data model such as adding parameter selections. Click on the “+” sign on the top-left corner in the ‘Diagram’ tab to create the new data set. Then select “SQL query”. A window will pop-up to create the script.
Step 3: For the data source, select “ApplicationDB_FSCM” and “Standard SQL” for Type of SQL selection. Name the data model the way you want.
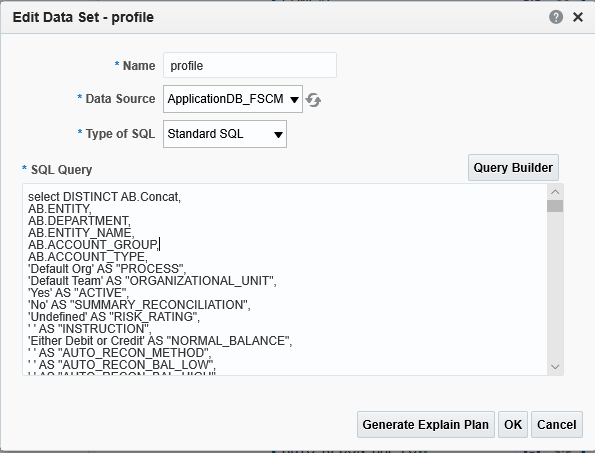
Step 4: Input the query to retrieve all the data from multiple tables in which it contains. Select only the columns we need to show in the report. Then, linked all the columns from multiple tables by common keys.
There are some main tables used to retrieve data for ARCS extract:
Step 5: For the ARCS profile extract, there are a lot of columns we need to build successful profiles in ARCS. But the most important columns that need to be focused are Profile Segment 1, Profile Segment 2, Profile Segment 3, Profile Segment 4, Account Name and Description. The other columns can set as default.
Step 6: Apply all the filters to take away the unwanted intersections, to avoid them to show up in the report. This step can be based on the mapping in Data Management then click ‘OK’.
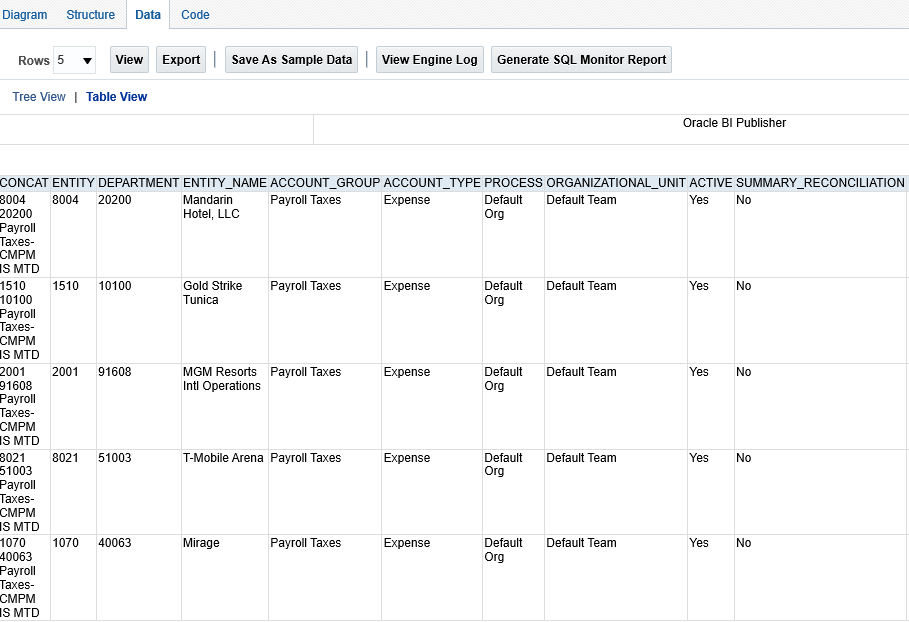
Step 7: After completing the script, click on the save icon in the top-right corner, input the name and select the folder you want to save it into. Before we can start creating the report layout, we need to generate a set of sample data so that it can be used while building the report layout. Click on the “Data” tab and select how many numbers of rows to display (there are options to show from 5 up to 200 rows). The purpose of this step is usually to validate the data. Click “View” to proceed and select the “Table View”. Then click “Save As Sample Data” if this data set is okay and ready to build the report layout.
Step 8: Click on “Create Report” then a window will pop-up. Select “Use Data Model” and “Use Report Editor” and click “Finish”.
I will then select the Blank (Landscape) for this report since there are a lot of columns needed to show.
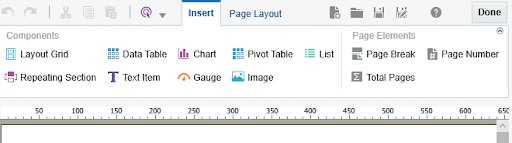
Step 9: In the report editor, click on the “insert” tab, then drag and drop “Data Table” to the sheet. This will create a table area where you can place the columns.
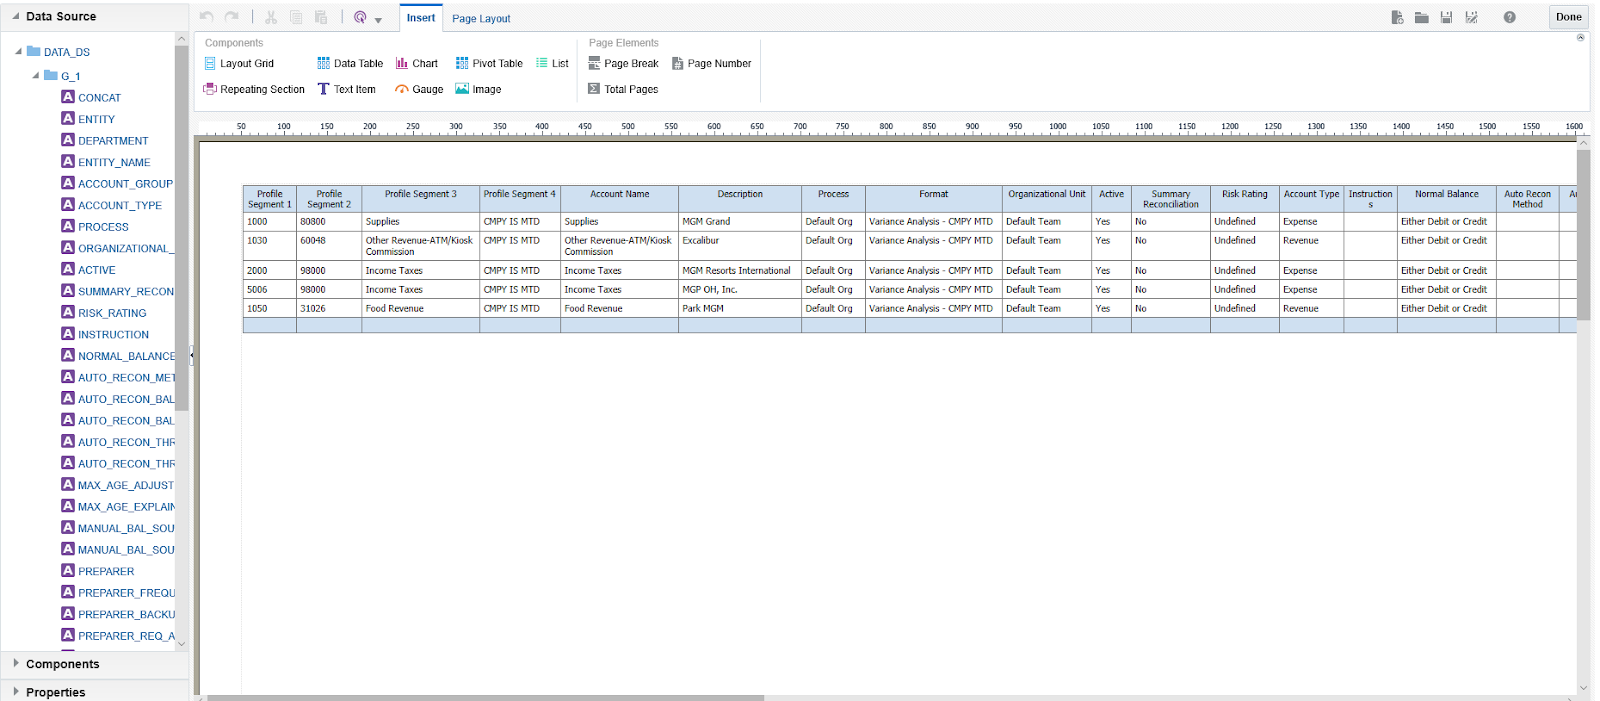
Step 9: Under the “Data Source” on the left-hand side, all columns built in the data model show up. Drag and drop the columns to the table area and adjust the width to fit the page and content. There are options to change the headers just by double clicking on the field or changing the formatting is under the “Properties” tab. Save it once finished by clicking “Done”.
Step 10: Click “View Report” to preview your completed report and export it by selecting “Export” in the “Action” menu.
Schedule your Free Demo, and see it in action!
Witness 12 systems reconcile almost 1,000,000 transactions in minutes from 12 different files. Process Completion Notifications and Reconciliation Reports will be generated as part of the demo. No human interaction is used in the entire process!
We offer Autonomous Systems for EPM Cloud Applications such as Oracle Planning & Budgeting Cloud Service (PBCS)/EPBCS, Financial Close & Consolidations Cloud Service (FCCS), Hyperion Financial Management (HFM), Account Reconciliation Cloud Service (ARCS), Profitability & Cost Management (PCM) and more.
 Vivian Truong is a Principal Consultant for Paradigm SES
Vivian Truong is a consultant at Paradigm SES.
Paradigm SES provides EPM and BI solutions to companies across the globe. Our team of experts have over 30 years of hands-on functional experience. We deliver process improvements, data management, data visualization and reports, and greater insights for a variety of Fortune 500 companies.
We are passionate about creating better work environments through efficiency and imaginative solutions.