Business Intelligence Tools for CRE Site Selection
As CRE professionals know, successful site selection begins with certain metrics - traffic flow and traffic count, market analysis, property size, and demographics data. We have built a powerful Business Intelligence dashboard which allows a user to aggregate useful information into one mapping application. Although various sources of data can be aggregated to visualize any metric, we will focus on three common site selection criteria.
Traffic Counts
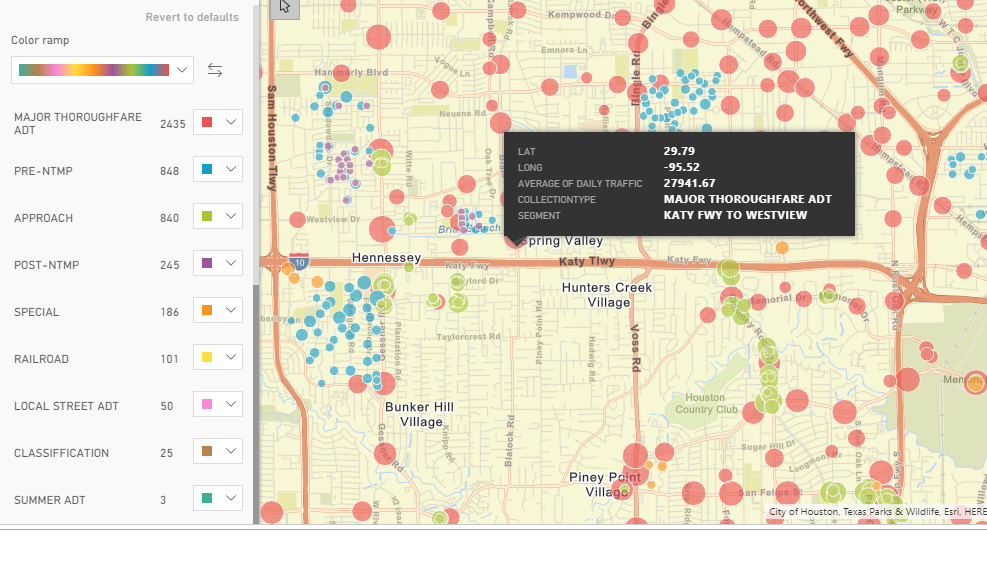
Retailers such as Starbucks typically have requirements which a prospective site must meet. Starbucks prefers traffic counts of at least 25,000 vehicles per day. We pulled Average Daily Traffic data for the City of Houston and created the following mapping visualization.
Each point in the dataset is reflective of a location where a traffic count device was placed in order to measure the volume of traffic.
Traffic counts in Houston are performed regularly throughout the year, unlike some other cities; as such, this dataset updates regularly. We can even pull live data, and the mapping app will update without needing to reload any data manually. The following are a few of the metrics in the data set.
- Segment (Street name and direction)
- Collection Type (Major Thoroughfare, Pre NTMP, etc)
- Average Daily Traffic
- Location of measurement (Address or Coordinates)
Notice that the circles come in various shapes and sizes. The larger a circle is, the higher the Average Daily Traffic Count for that location is. The colors illustrate the "Collection Type".
The City of Houston’s Public Works and Engineering Department is responsible for performing traffic counts through the Traffic Operations Division.
The City of Houston captures traffic activity and throughput through the use of traffic counts, which are turned into Average Daily Traffic (ADT) counts estimates to provide approximate estimates of the utilization of a street. For Real Estate developers, a high traffic area may not be ideal for residential single family units. However, for retailers, high traffic volume means more business.
Population
Population density, Total Population and Population Growth can help site selection professionals get a good feel of the potential market for their future stores. Similar to high traffic volumes, areas with higher population density means more potential customers.
We have layered a Total Population metric on the top right-hand corner of this dashboard. As the user zooms in or out, the Total Population changes accordingly. Any other metrics can be added such as
- Median Age
- Population Density
- Average Household Size
- Total Education Attainment
- Per Capita Income...and more
If the site selection is for a new Jr. High School, we can show Population by age (under 14 years old). If the site selection is for a Home Depot, we can show Home Ownership metrics.
A Business Intelligence dashboard can be designed for any need and can visualize all types of data including location of new easements, future right-of-ways and even final plat approvals. We can even include the document names for any final plat approval to review.
We will continue to assume that we are searching for a new Starbucks location and proceed with the next metric.
Median Household Income
Starbucks typically requires that a prospective site be in a Neighborhood where the Median household income is $60,000 and up.
Some site selection criteria calls for Average Household Income. Your Business Intelligence dashboard and mapping app can be custom built to your specific needs or metrics such as:
- Median Disposable Income
- Average Household Income
- Median Home Value
- many other income metrics
We can even combine data from other sources such as County or Municipal Crime statistics to visualize crime across the City of Houston.
In this example we have previewed a possible location with a Major Thoroughfare. The Median Household Income is around $200,000.
This area would be an ideal location for Starbucks.
In Commercial Real Estate, each project is unique. Properties, market conditions, and other factors contribute to the uncertainties that commercial real estate professionals face. A great way to handle the uncertainty is by measuring tangible characteristics and visualizing complex data sets. The data is out there, and it is waiting to be leveraged by CRE professionals. At Paradigm SES, we can make it easier for you to get ahead of the competition. If you're ready to see all the ways to improve performance and make more insightful decisions, give us a call at (832) 396-7583 or send us an email (info@paradigmses.com). We can show you a Free Demo with the data of your choice.