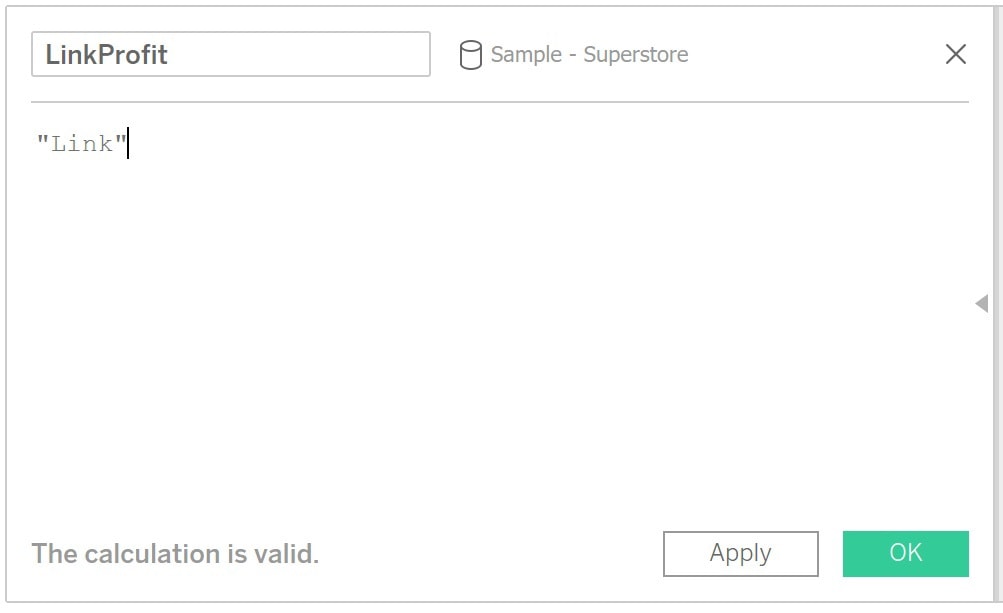
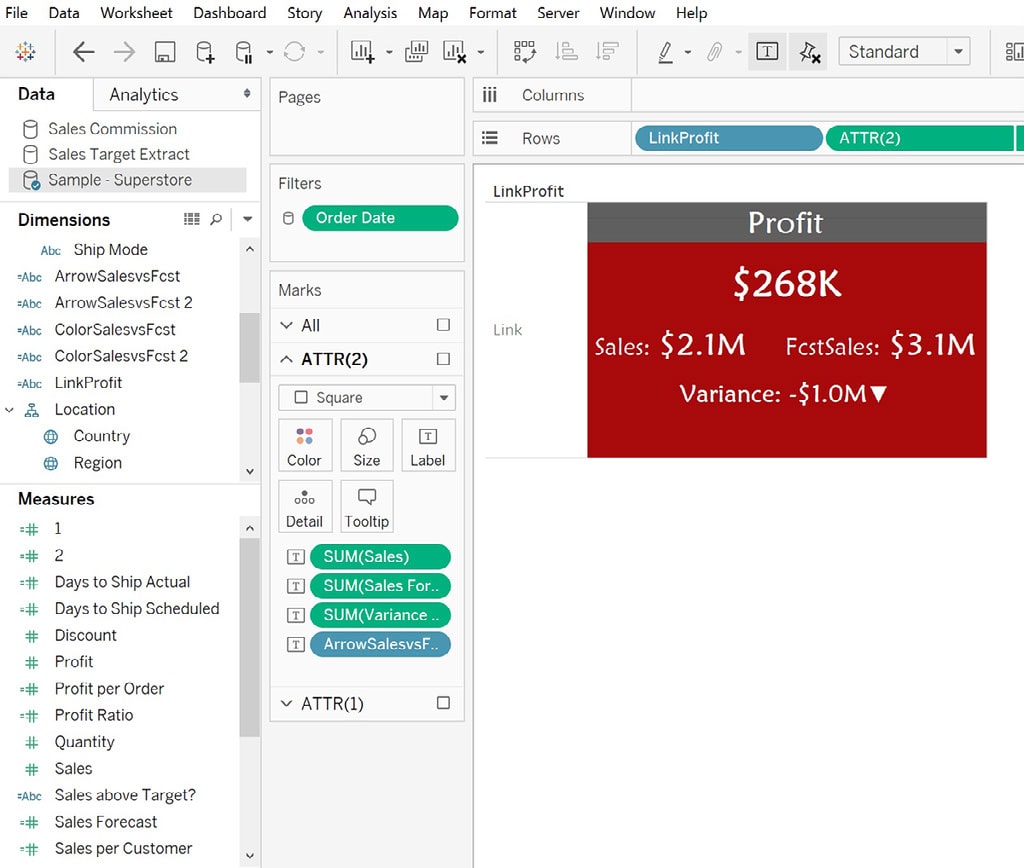
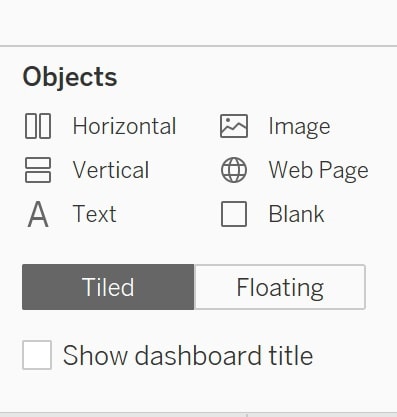
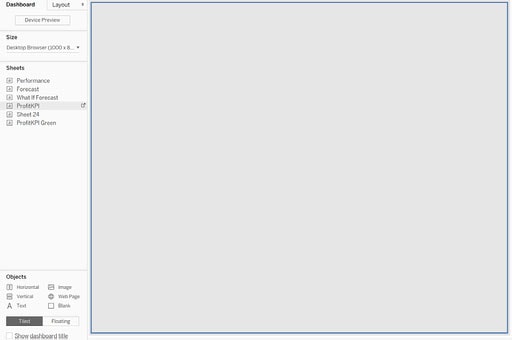
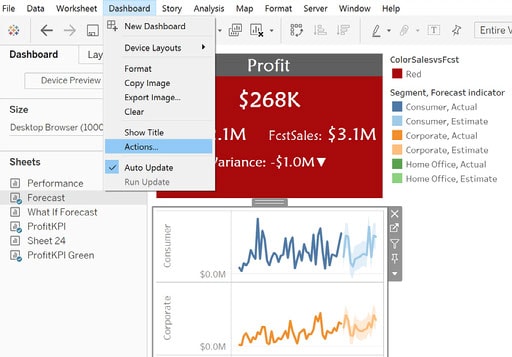
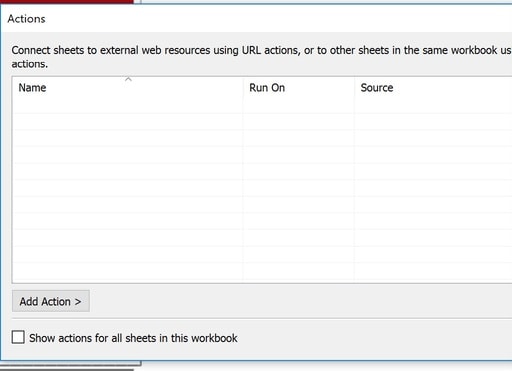
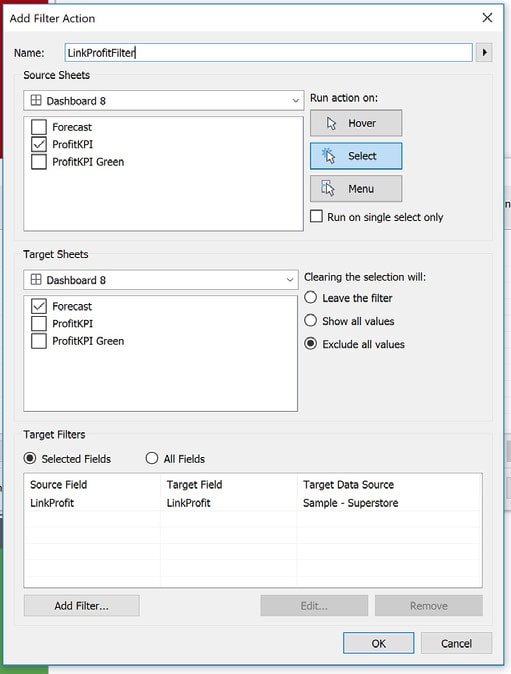
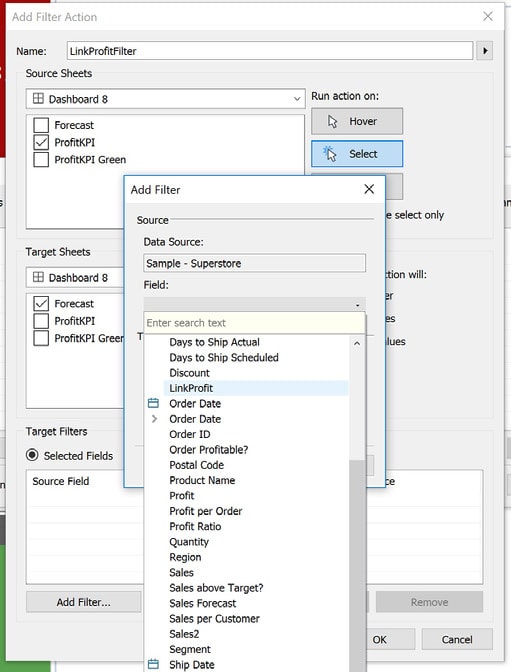
In this tutorial we will give step by step instructions on how to put together the dashboard for the KPIs and attach charts that will expand and contract by clicking on the tiles.
For other Tableau tutorials, visit the tutorials "Tableau: Creating Dual Layered Color Changing KPI Tiles" and "Tableau: Creating A Navigation Button to Another Dashboard".
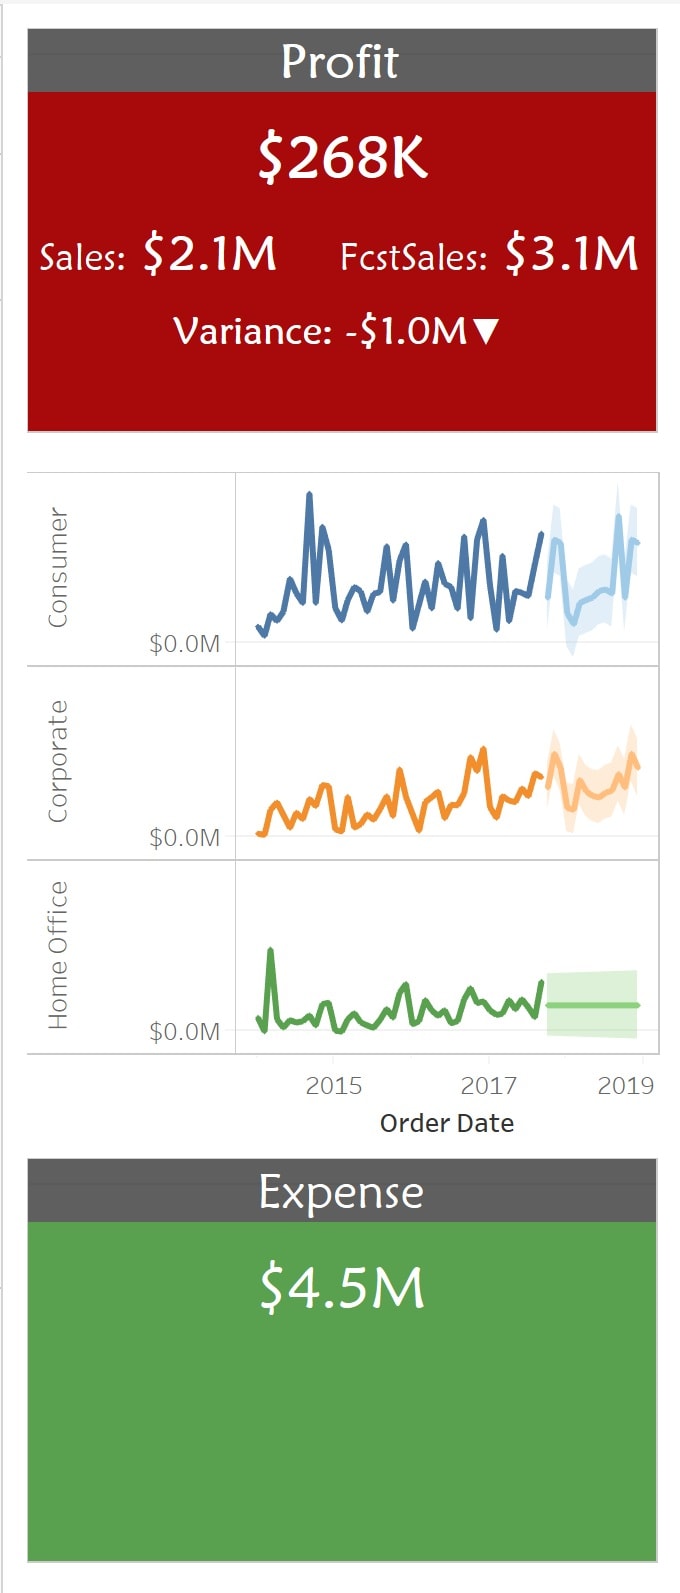
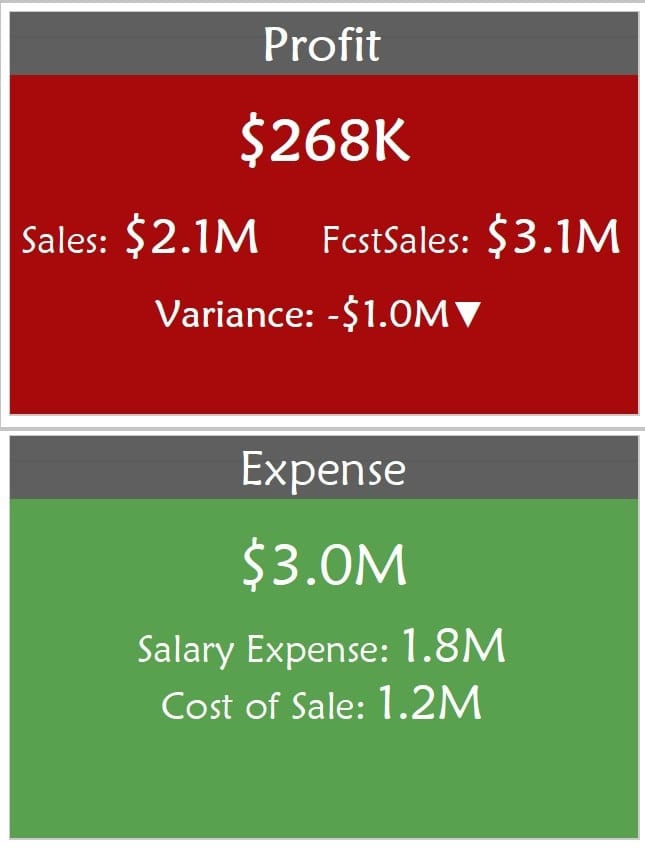
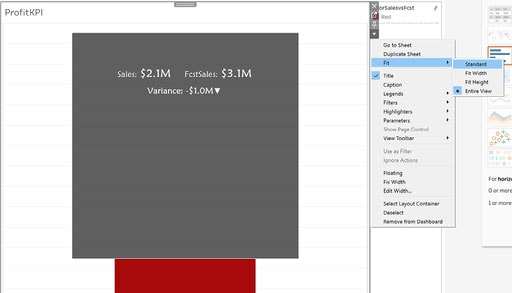
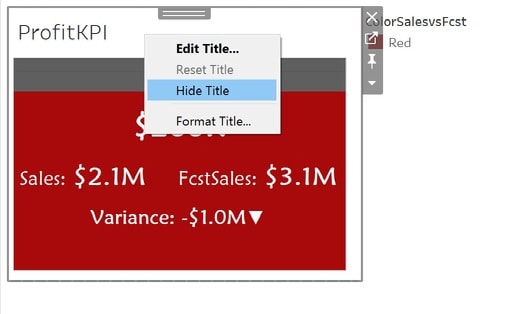
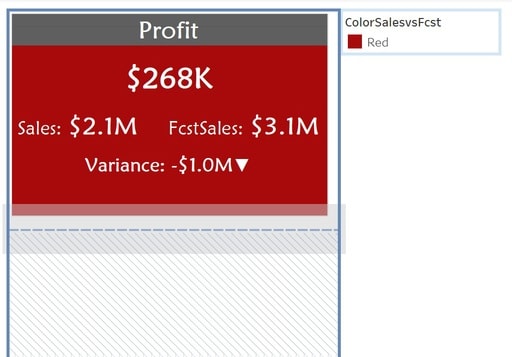
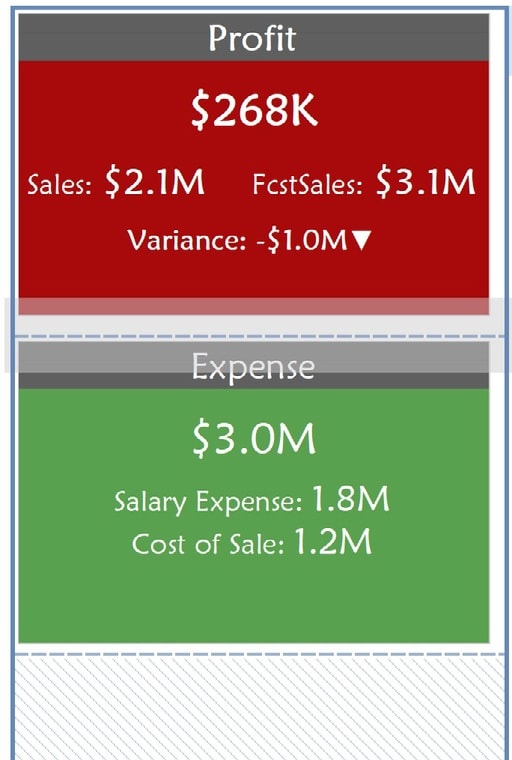
Step 1. Create a calculated field, for this sample I have named it LinkProfit.
Step 2. Give it a value of "Link" (This calculation will hold as the connection between the chart and the KPI, so the content does not matter).
Step 3. Drag and drop the link into rows. You will see that an axis for Link appears next to the tile. Right click and uncheck Show Header.
Step 4. Drag and drop the same calculated field to the Chart that we need to expand by clicking the tile.
Step 5. Drag and drop a vertical container to the dashboard (Make sure "Tiled" is selected instead of "Floating").
Step 6. Drag and drop the Profit KPI into the container, make sure the entire container is selected (gray) when making the drop.
Step 7. Select the new profit's container.
Step 8. In the right hand side of the profits container, click the drop down arrow -> Fit -> Standard.
Step 9. Right click tile -> Hide Title.
Step 10. Drag and drop the second KPI under the Profit KPI. For this example I will use the Expense KPI.
Step 11. Make sure a dotted line appears before releasing the drop (see screen shot below).
Step 12. Change fit to standard and hide title for the new KPI tile.
Step 13. You may need to resize the container to make the entire tile fit in view.
Step 14. Place the chart in between the 2 tiles, make sure dotted line appears before releasing the drop.
Step 15. Hide chart title.
Step 16. Go to Dashboard -> Actions, to open up the Actions window.
Step 17. Click on Add Action -> Filter.
Step 18. In the "Source Sheets," select the tile you would like to use as the button to control the chart.
Step 19. In the "Target Sheets," select the chart to expand and contract.
Step 20. Change "Run action on" to Select.
Step 21. Change "Clearing the selection will:" to Exclude all values.
Step 22. Change "Target Filters" to Selected Fields.
Step 23. Click on "Add filter" below the Target Filter section.
Step 24. Select LinkProfit for both source and target field, this is the calculated field we created earlier.
Step 25. Click OK.
At this point the link is complete, the chart should toggle expand and contract by clicking on the tile.