RELATED CONTENT
Case Study - Crypto-Currency Pt. 1
This case study focused on crypto-currency and comparing between 3 different BI tools (Tableau vs Power BI vs Qlikview). 3 of our consultants tested these 3 popular BI tools with Bitcoin and Ethereum historical data. For more information, click here.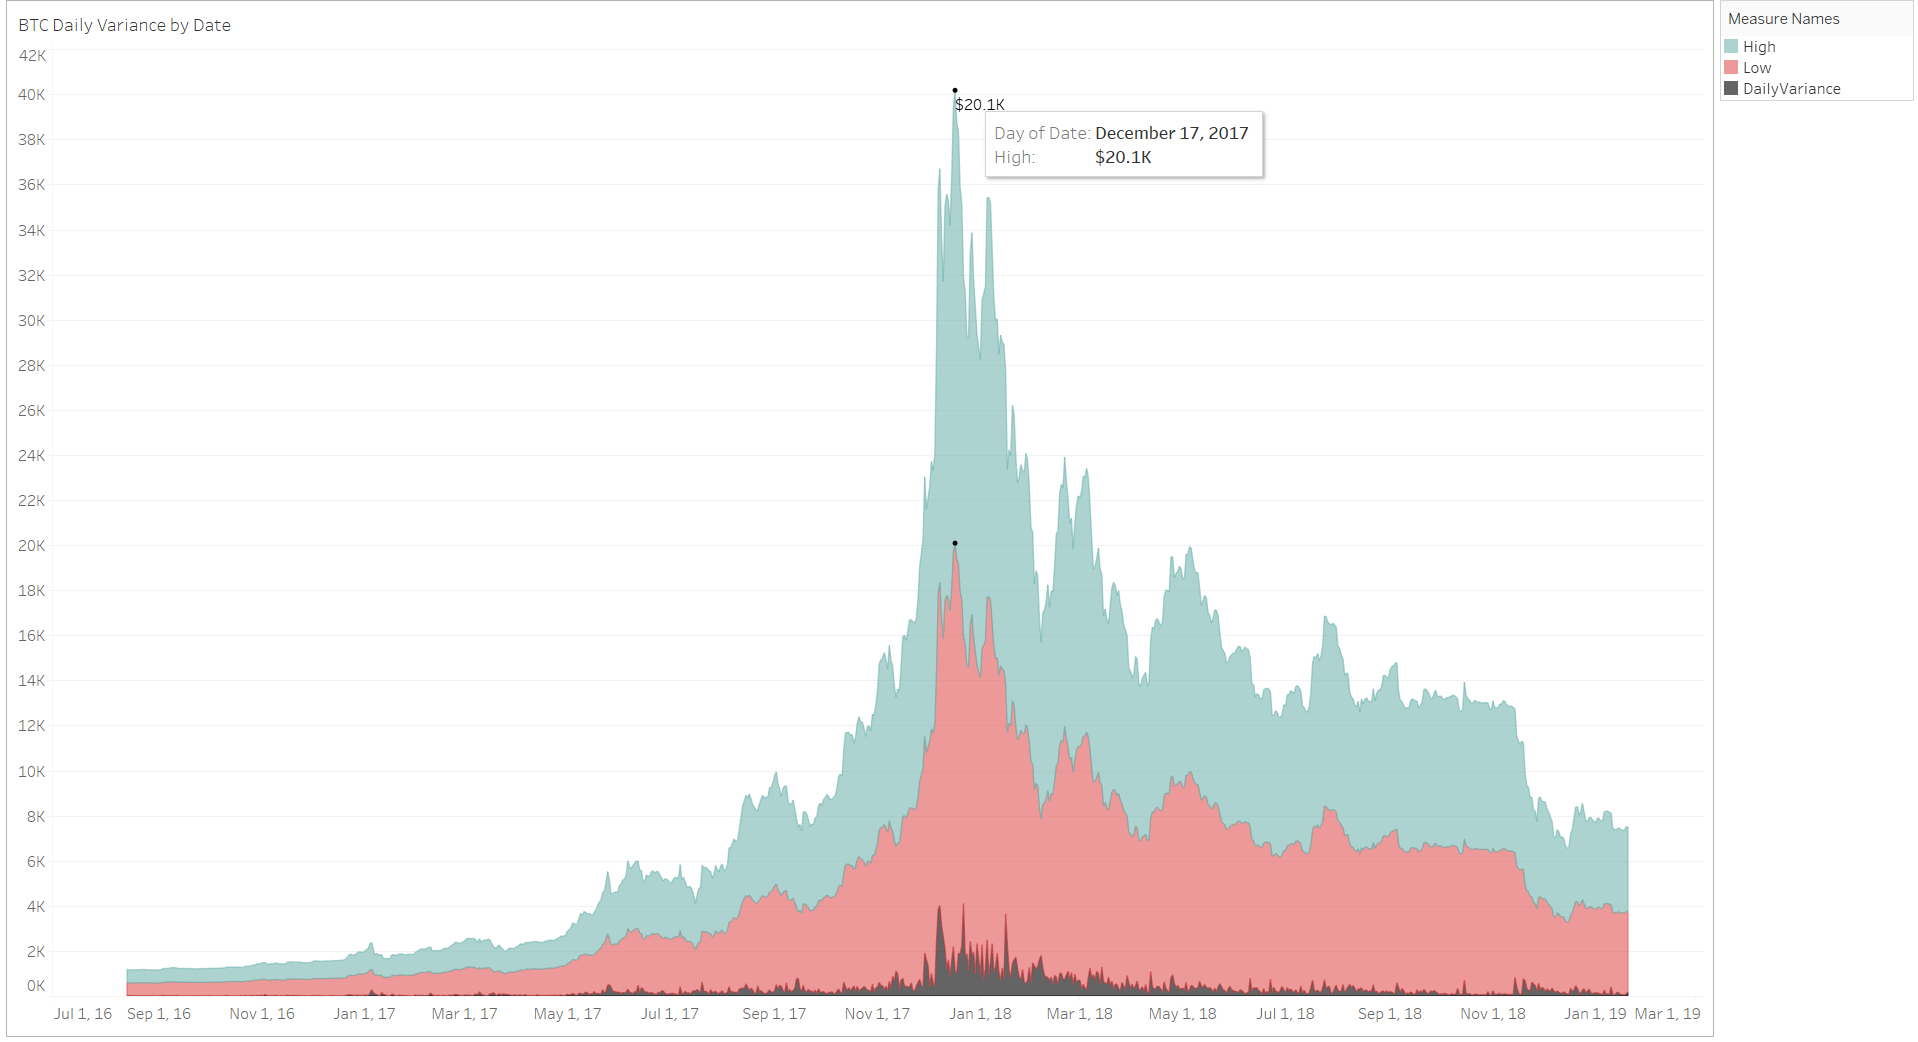
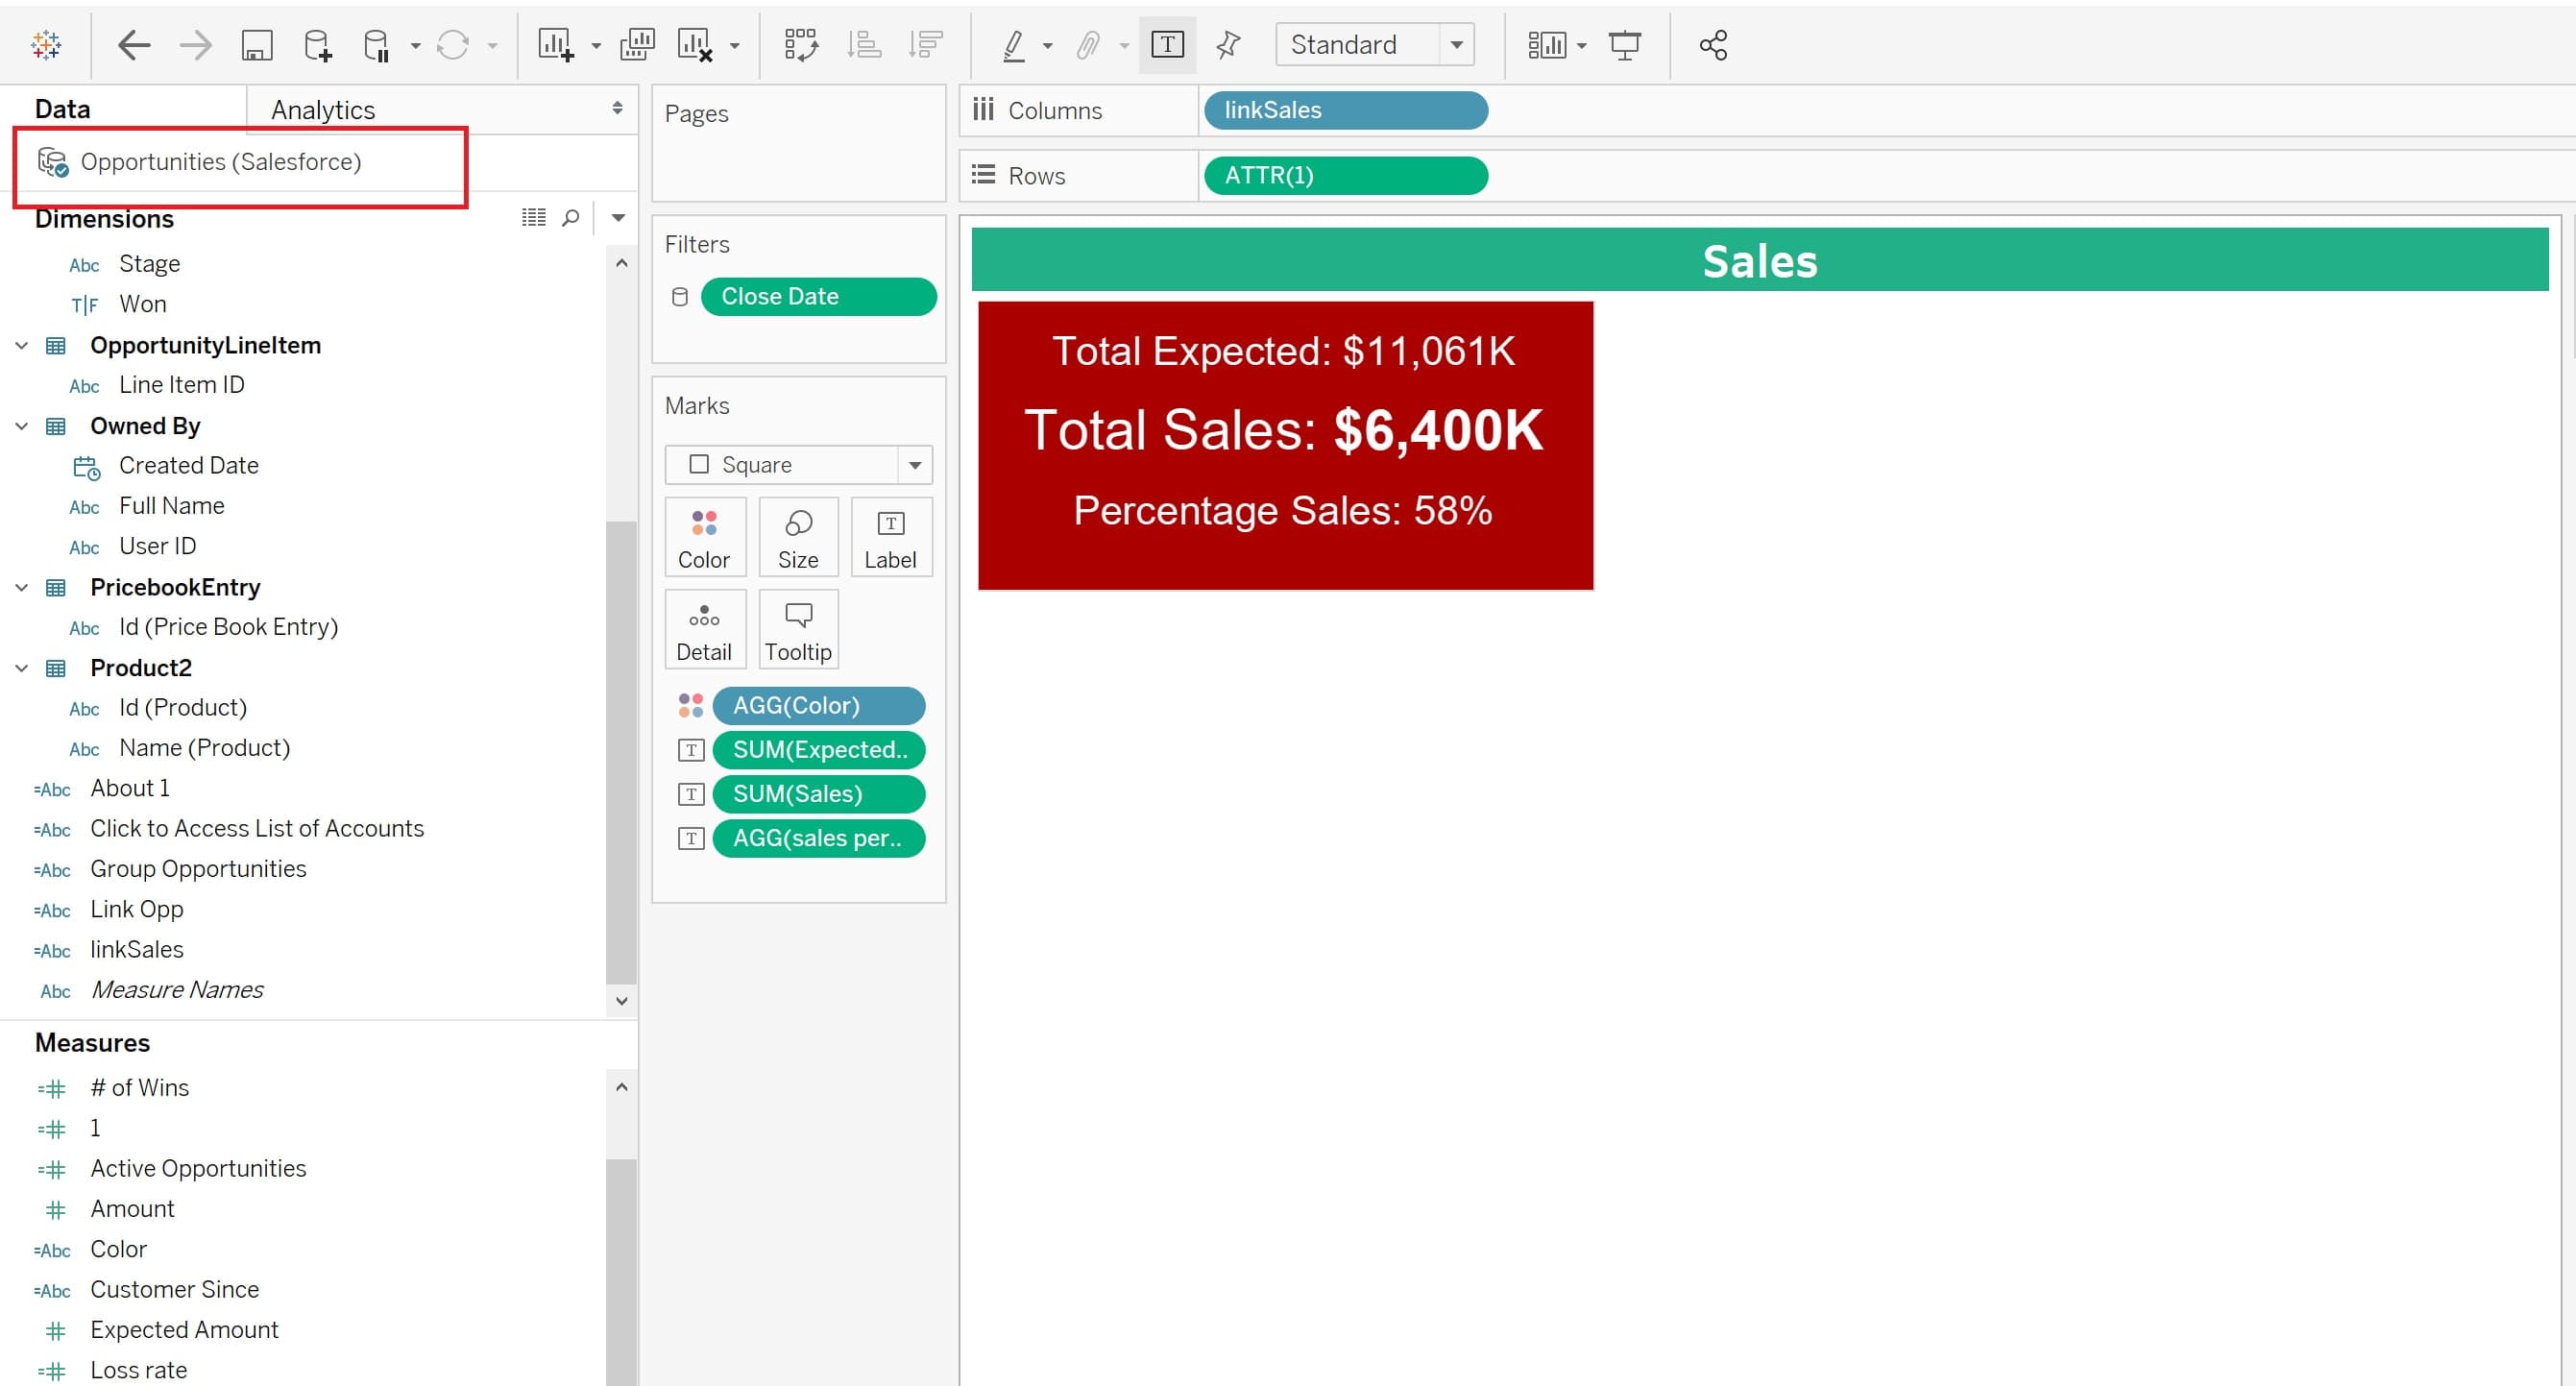
Tutorial - Tableau Tutorials Series
This tutorial series focused on creating KPI tiles, navigation buttons to other dashboards, and making expandable charts using the action menu in Tableau.- For information on creating KPI tiles, click here.
- For information on creating navigation buttons to other dashboards, click here.
- For information on creating expandable charts, click here.
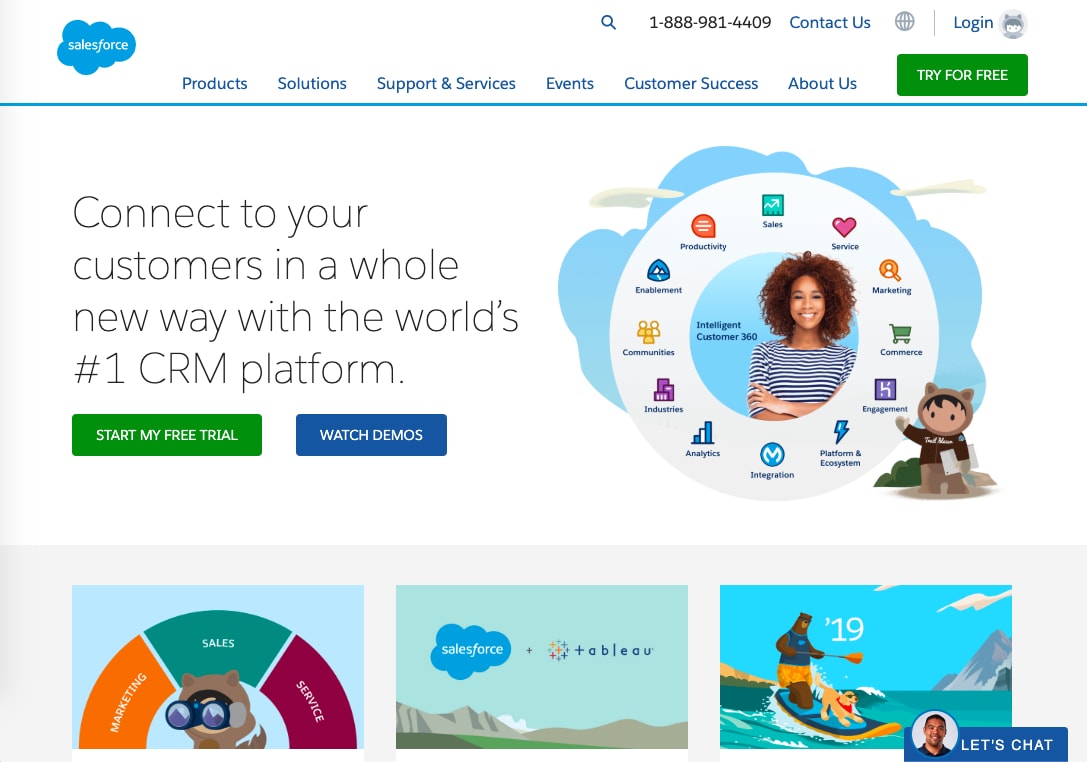
Article - The Salesforce Acquisition of Tableau
This article focuses on the Salesforce Acquisition of Tableau and what that means for the future. It has been a recent trend for many other companies to aquire business intelligence tools (Google buying Looker, Microsoft buying Linkedin, etc.). The importance of big data and understanding it by using BI tools will continue to grow more important in the future. For more information, click here.